
optional homework vs. graded homework
In order to determine whether homework should be eliminated I was interested to see whether or not there was a difference in grades between students who chose to do the optional homework and students who chose not do the optional homework. I had planned to do this by analyzing the quiz scores of students who chose to do the optional homework in comparison to the scores of students who chose not to do homework. Since my sample size was very small and the number of students who chose to do the homework was even smaller, I decided not to compare and contrast the quiz scores because I did not think that it would be very telling of what was going on in the classroom when one category (students who did the optional homework) was reliant on only 1 or 2 students’ quiz scores. Rather, I continued the optional homework pedagogy in order to gather more data.
After implementing optional homework in the classroom my students had 3 homework assignments over the course of 5 school days. In my 2nd period class many students came to the front of the room to get the handout with the assignment. At the beginning of each class I asked students to turn in the homework if they completed it. In my 2nd period, no students moved, so I repeated myself. The majority of students stared at me while 2 students turned the assignment in for feedback. I was surprised that only two students turned the homework in based on the number of students I saw take the assignment and the responses from the “Optional Homework Survey” (Artifact 7B). Perhaps perceived peer pressure (majority of students not doing homework) influenced students who had done the homework to withhold their completed assignment.
After implementing optional homework in the classroom my students had 3 homework assignments over the course of 5 school days. In my 2nd period class many students came to the front of the room to get the handout with the assignment. At the beginning of each class I asked students to turn in the homework if they completed it. In my 2nd period, no students moved, so I repeated myself. The majority of students stared at me while 2 students turned the assignment in for feedback. I was surprised that only two students turned the homework in based on the number of students I saw take the assignment and the responses from the “Optional Homework Survey” (Artifact 7B). Perhaps perceived peer pressure (majority of students not doing homework) influenced students who had done the homework to withhold their completed assignment.
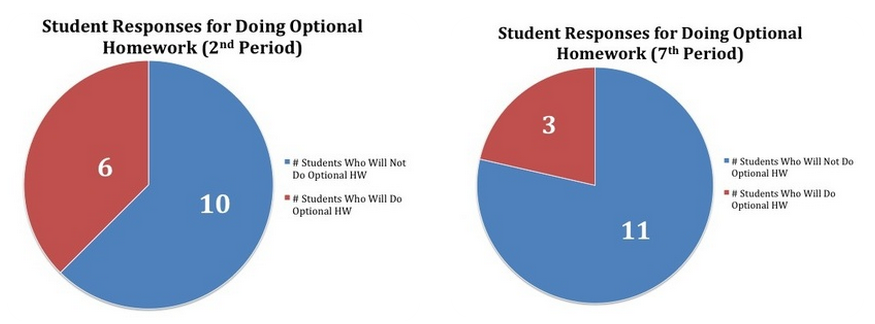
Using the surveys, I tallied the number of students who responded that they would do the homework and the number of students who responded that they would not do the homework (including students who wrote conditions for possibly doing the homework). As shown in Artifact 8A, in both classes the majority of students responded on the survey that they would not be doing the optional homework as seen in Figure 5, and I observed that many students who said they would do the optional homework did not end up doing the homework. Student responses ranged from “It’s optional so I don’t got to do it” and “No. Because I have things to do and it’s Friday!!! And it doesn’t count.” to “I’m going to do it for my own benefit.” For the few homework assignments I did receive, I made sure I gave these students written feedback on the homework by the next class.
As I told my students, the quiz would only cover the material from that past week of class. The only exception was the extra credit question (2 pts), which would have no negative effect on students’ grades. Quiz #10 (Artifact 8C) covered the introduction to covalent bonding including identifying types of bonds using the Pauling scale and naming and writing molecular formulas for covalent compounds with a possible 47 points out of 45 points including extra credit. My analysis of quiz scores (Artifact 8B) shows 1 or 2 students who are outliers in my data. The majority of my students in 2nd and 7th period (35 students out of 44 students) made an A on the quiz (41/45, 91%). The average for 2nd period (25 students) was also a 41/45 (91%) on the quiz, but this value includes 1 student who received a 0 on his quiz because he cut class on the day of the quiz. Without this student’s score in the average, the average for 2nd period then becomes 43/45 or 96%.
The quiz average for 7th period (19 students), however, was lower with 39/45 or 87%. This data is skewed though because 3 of the 19 students received a 0 on their quiz. Two of these students received a 0 because they cut class on the day of the quiz and 1 student received a 0 because he had cut class the entire 2 weeks beforehand so he had no idea what he was doing. He wrote me a note on his quiz, “Sorry I cut your class.. I learned my lesson.” Since 7th period is a significantly smaller class in comparison to 2nd period, the 3 zeros on the quiz have a greater affect on the class average. Without these 3 students, the class average is a 42/45 or 93%. This shows that the 3 outlier data points brought the class average down by 3 points or 6%.
Once I had collected all of the artifacts I decided to exclude the student from 2nd period who cut class for Quiz #10 because he cut class for almost 2 months so consequently he missed all of the quizzes. After further analysis of my data I decided to exclude a total of 8 students who either often cut class (not only on quiz day) or were absent more days than they were present in school. Five of these students were in 2nd period and the remaining three students were in 7th period. Without the inclusion of these eight students I have a better representation of the impact of optional and graded homework with students who were regularly in class.
I think it is fascinating that the majority of students in both classes got an A on the quiz (usually not the case), and I was interested to see whether this would also be the case for the next quiz when homework is assigned and graded beforehand. At this point in my inquiry this first piece of my optional homework research is inconclusive because I have not yet collected sufficient data. As a way to follow up this first take of optional homework vs. required homework, I gave students a survey asking them to reflect on their quiz scores and whether they did the optional homework. I expected that many students’ beliefs about the optional homework and whether or not they would do it in the subsequent weeks would have remained unchanged because the quiz scores were high across the boards for all students (Artifact 8A).
